This would appear to defer any network impacts for multiple years, however, there are near-term impacts this technology brings. Adoption of collision avoidance technology (such as lane keeping, automated emergency braking, blind spot detection, and even backup cameras) is growing rapidly. Simple analysis reveals that this technology reduces collisions, and thus, collision parts.
For our parts logistics networks, the primary consideration is how many collision parts will be needed and the size of the parts needed, impacting the space required to house collision parts. Cost does not affect network space requirements, so this is out of scope for the analysis. This document presents Carlisle’s projections of collision frequency (number of collisions), and collision severity (derived by magnitude of physical damage and part size).
Starting Factors
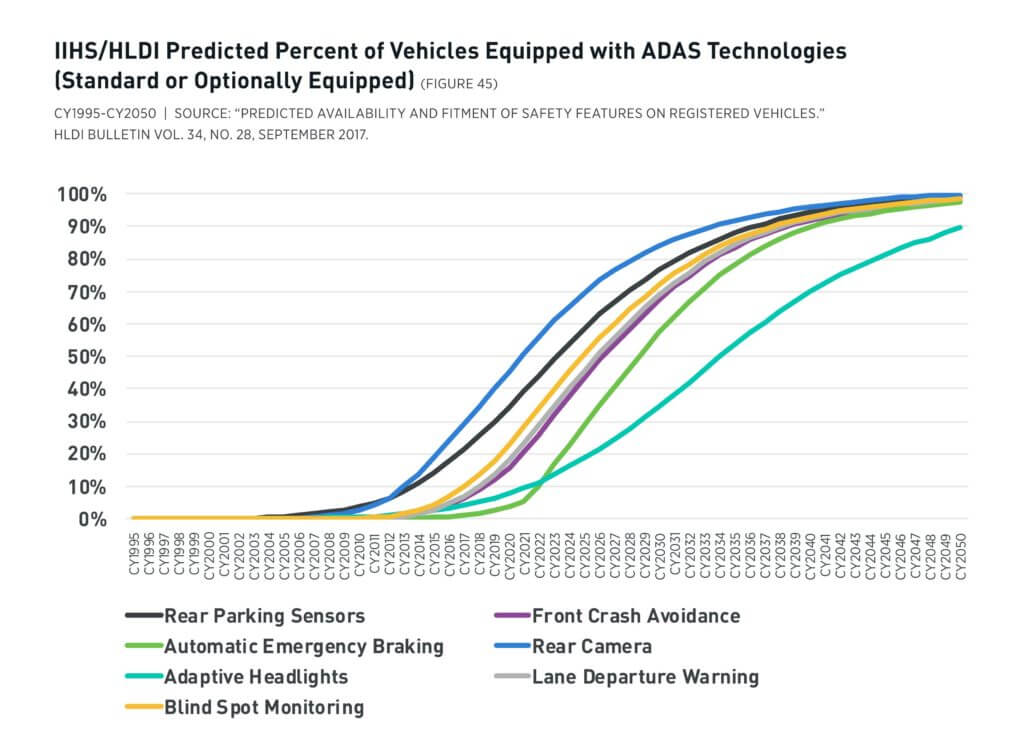
The Insurance Institute for Highway Safety (IIHS) projects rapid growth, and we use their predictions (shown below). Specifically, we focus on the line for what IIHS calls “Front Crash Avoidance”. Although all the technologies reduce collision risk, we’ve chosen Front Crash Avoidance as the baseline for our model because it has high effectiveness. Front crash avoidance adoption is forecasted to increase from 10% in 2018 to 100% in 2050.
Collision Frequency
Now that we’ve established the adoption rate of effective collision avoidance technology, we need to determine the projected change in collision frequency. There are five key variables that influence collision rates: driver, another driver, environment, maintenance, and vehicle attributes. According to NHTSA, 95% of collisions are caused by the first two variables – driver (57%) and another driver (38%). We estimate driver-related collisions to decrease proportionately with the increase in cars with this technology, while “another driver” related collisions to decrease sharply via “herd immunity” – more vehicles on the road with this technology makes the road safer as a whole. Employing a weighted average across the five variables, we estimate a 27% decline in collision frequencies by 2050.
| Year | Percent Change |
|---|---|
| CY2018 | 0% |
| CY2024 | -8% |
| CY2030 | -17% |
| CY2036 | -23% |
| CY2050 | -27% |
Collision Severity
Next, we examine collision severity, which can be described as “the number of parts replaced in a given collision.” Here, we use the same aforementioned five variables and use collision claim data – primarily from Certified Collateral Corporation (CCC) – as well as part complexity forecasts to project each variable. We estimate part counts to decrease for driver-caused collisions, roughly inverse to the adoption of collision avoidance technology. This is because the technology reduces the speed in which a collision occurs. Collisions caused by another driver initially become more severe – this is the hangover of very severe distracted driving collisions. Yet once enough other drivers have the technology, we estimate the part counts to decrease at rates similar to driver-related collisions. Again, after appropriately weighting variables, we end up with a 41% decline in parts replaced by 2050.
| Year | Percent Change |
|---|---|
| CY2018 | 0% |
| CY2024 | -7% |
| CY2030 | -25% |
| CY2036 | -40% |
| CY2050 | -41% |
Impact on the Parts Logistics Network
When we combine frequency (27% drop) with severity (41% drop), we reach a 2050 scenario where 57% fewer collision parts could be sold. Assuming constant inventory turns, this also indicates stocking volumes will reduce by 57% in the network.
We expect a 57% drop in the volume, but if the remaining parts are very large (sheet metal, glass, etc.), that could unexpectedly add network space. Again, this 57% figure does not include impacts from future total loss rates or future genuine parts penetration, which could drag this figure down much further.
| Year | Percent Change |
|---|---|
| CY2018 | 0 |
| CY2024 | -0.14 |
| CY2030 | -0.38 |
| CY2036 | -0.54 |
| CY2050 | -0.57 |
Other Considerations
Future Total Loss Rates
We expect these rates to increase, but modeling an increase (and thus an impact from the increase) is difficult for two reasons. Concisely:
- Magnitude: We do expect total loss rates to increase in the future, but we are not sure when or by how much due to the complexity of forecasting the changes in residual values.
- Effect: The conventional wisdom is that increasing total loss rates are damaging for an OEM’s collision business. Vehicles deemed as total losses flow through the salvage channel, through which at least a few parts are typically saved, refurbished or remanufactured, and sold. These salvage parts directly compete with OEM genuine collision parts. If total loss rates increase due to the increased complexity (and costs) of collision avoidance technology, it’s logical to assume this will hurt genuine parts sales. However, it’s difficult to determine how much genuine sales will change. On one hand, we may see a trend similar to the historic trend. On the other hand, it’s possible that all the parts with collision avoidance technology will not be salvaged, whereas all the parts with existing aftermarket competition will continue to be salvaged as they always have been.
- Conclusion: Total loss rates are unlikely to drive additional collision parts sales in the future, and thus unlikely to cause an increase in space required.
Genuine Parts Penetration Rates
The model and results shown above do not incorporate significant changes in genuine parts penetration rates. There are two reasons to think genuine parts penetration rates will increase in the future – both of which would require increased network space due to increased sales. Again, a brief overview of our perspective:
- Complexity: As collision parts get more complex, we expect that the aftermarket will be unable to keep up with quality standards and integrations. We have included a roughly 2% increase in parts complexity in our model, as we’re confident that complexity will in fact increase. This number may be too low. It’s unlikely to be below zero, but we are reluctant to estimate an upper bound.
- Volume: As collisions become less frequent, volume of collision parts will drop as proven above. As volumes drop, the collision market becomes less economically attractive for aftermarket competitors (i.e. collision body shops). That being said, parts that were formerly competitive may become captive. We have not incorporated this dynamic into our main modeling as the magnitude is uncertain.
- Conclusion: Genuine parts penetration rates will likely rise in the future. We have incorporated some of this dynamic into our model, but the specific values are challenging to project.
When we do include our predictions for these other considerations, the impacts are notably intensified as shown below.
| Year | Original Curve | Including Total Loss and Penetration |
|---|---|---|
| CY2018 | 0 | 0 |
| CY2024 | -0.14 | -0.14 |
| CY2030 | -0.43 | -0.38 |
| CY2036 | -0.57 | -0.54 |
| CY2050 | -0.61 | -0.57 |
Authors

Nate Chenenko
Director

Gabrielle Salomon
Senior Consultant